Building two homepage experiences at the same time
Web Design
Building two homepage experiences at the same time

Airtable
Airtable
Airtable
Senior Web Designer
Senior Web Designer
Senior Web Designer
January 2022 – August 2022
January 2022 – August 2022
January 2022 – August 2022
Building two homepage experiences at the same time
Building two homepage experiences at the same time
Building two homepage experiences at the same time
Formulating an effective strategy to unify the brand, product and company vision
Formulating an effective strategy to unify the brand, product and company vision
Formulating an effective strategy to unify the brand, product and company vision
Overview
Airtable’s homepage is outdated and doesn’t accurately reflect the latest conversion, brand, and product comprehension standards we want to show our prospects and returning customers.
Approach
To create a homepage experiment that will accelerate learnings and drive impact to key site metrics. Our approach includes the development of two new versions of our homepage that bring together our latest brand standards, messaging, and UX best practices.
A project of many firsts
Apart from redesigning the homepage experience, we also redesigned our cross-functional process and approach.
📚 Changing our process: Leading with a customer and data centric approach while adopting an experimentation mindset.
💻 Expanding our limits: Breaking the mold of our old technological restraints.
🎨 Evolving with our vision: Retooling our messaging and storytelling techniques.
The brand team was heavily involved in this project, from our Creative Director, Brand Designers, Copywriters, and Motion Designer, along with our Web Developers and Web Producer. We also partnered with our PMM to created a fortified strategy that aligns brand, product and story. With this experimental approach, we moved from a handoff waterfall process to an agile process with many iterations and explorations.
As I led the design process, I focused on our core web design philosophy:
Connected: How might everyone work together to bring all the pieces of the story to life?
Iterative: How might we move fast and seamless, integrating our learnings as we go?
Data driven: How might we make smart decisions that benefit everyone?
In the span of a year, new methodologies were introduced in this project to bolster these 3 points, such as: user testing, prototyping, A/B testing, brainstorms and creative concepts.

We wanted to improve our homepage to be more dynamic, product focused, and impactful. This meant to improve not just our story and layout, but our approach to the audience.
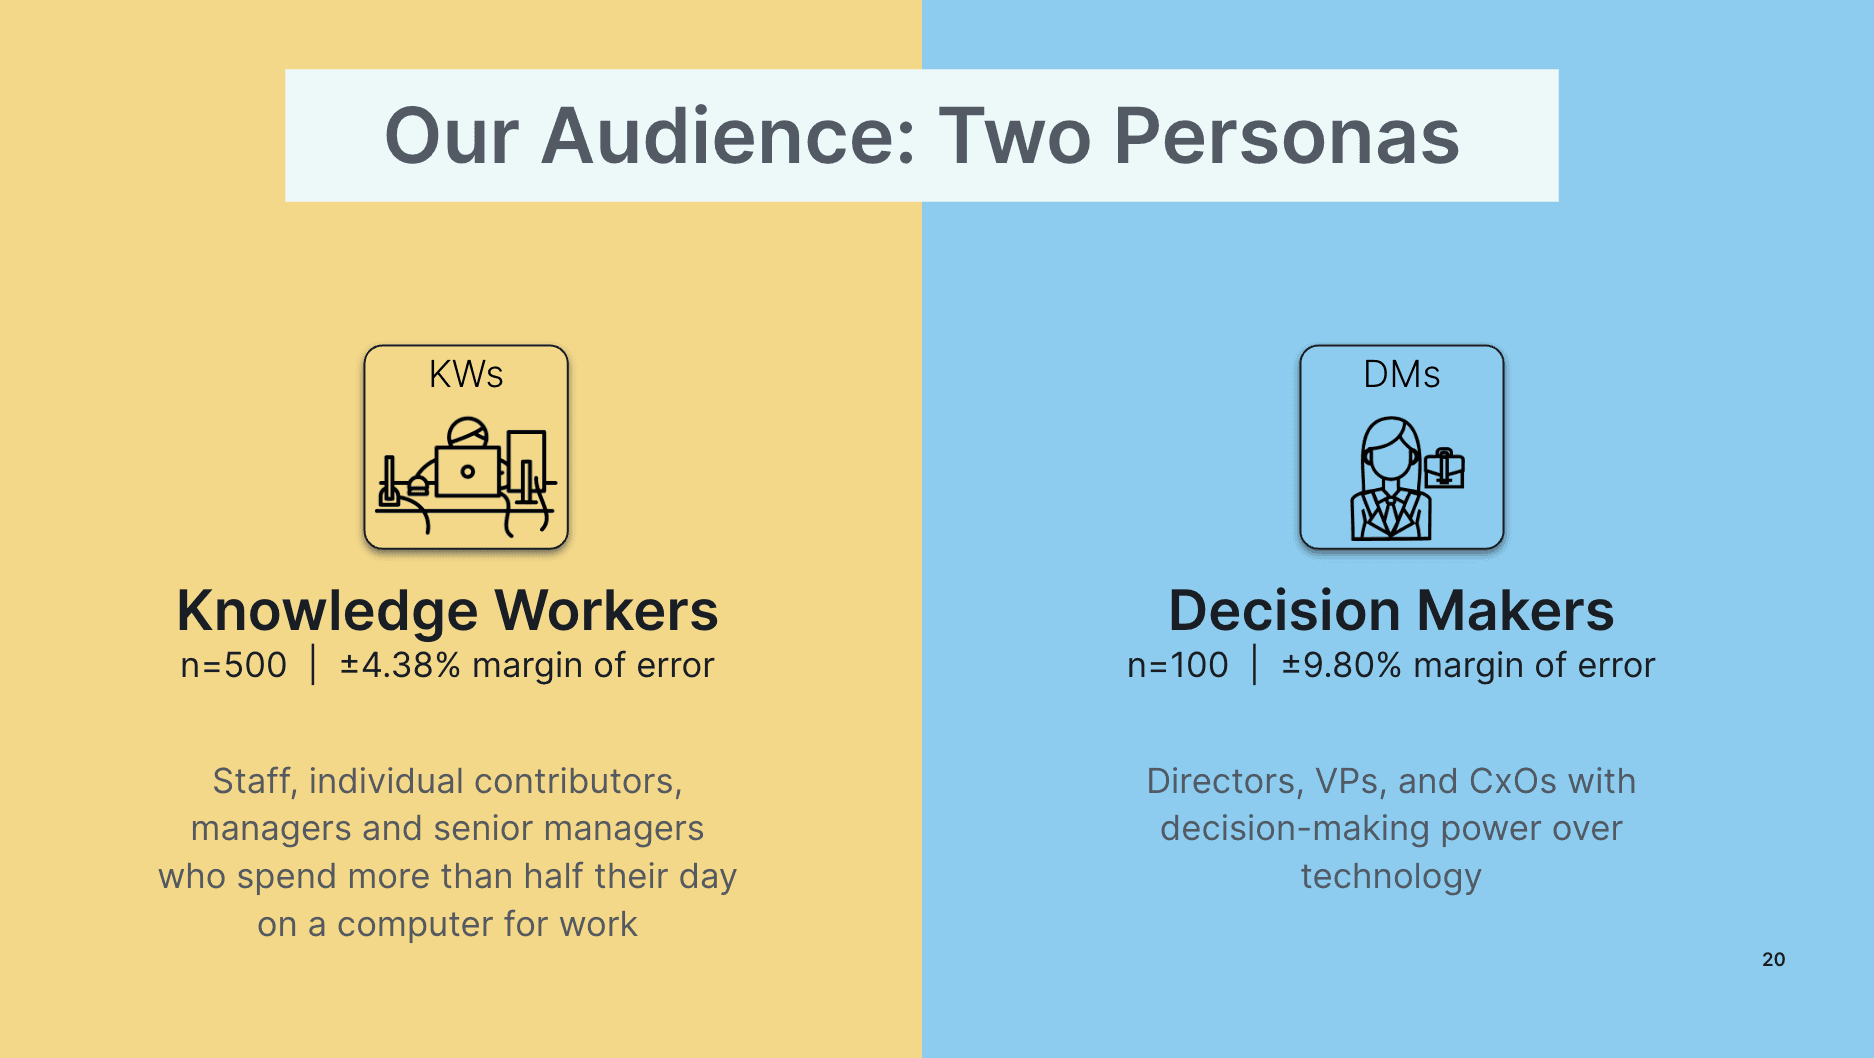
We focused on two main audiences, which helped shaped our user journeys. After conducting user testing with protoypes, we used their questions as our guide in building the page:
What is Airtable?
Who is it for?
What problems does it solve?
How is this company trustworthy/worth my time?

For the A/B test, we decided to differentiate by answering these questions with two distinct angles, showing the relationship between our product and our customer. Variation A was product focused, which we aptly named Toolkit. Variation B was customer focused, which we named "Built for you". Variation B also aligns with our "This is How" campaign.

A project of many firsts
Apart from redesigning the homepage experience, we also redesigned our cross-functional process and approach.
📚 Changing our process: Leading with a customer and data centric approach while adopting an experimentation mindset.
💻 Expanding our limits: Breaking the mold of our old technological restraints.
🎨 Evolving with our vision: Retooling our messaging and storytelling techniques.
The brand team was heavily involved in this project, from our Creative Director, Brand Designers, Copywriters, and Motion Designer, along with our Web Developers and Web Producer. We also partnered with our PMM to created a fortified strategy that aligns brand, product and story. With this experimental approach, we moved from a handoff waterfall process to an agile process with many iterations and explorations.
As I led the design process, I focused on our core web design philosophy:
Connected: How might everyone work together to bring all the pieces of the story to life?
Iterative: How might we move fast and seamless, integrating our learnings as we go?
Data driven: How might we make smart decisions that benefit everyone?
In the span of a year, new methodologies were introduced in this project to bolster these 3 points, such as: user testing, prototyping, A/B testing, brainstorms and creative concepts.
We wanted to improve our homepage to be more dynamic, product focused, and impactful. This meant to improve not just our story and layout, but our approach to the audience.
We focused on two main audiences, which helped shaped our user journeys. After conducting user testing with protoypes, we used their questions as our guide in building the page:
What is Airtable?
Who is it for?
What problems does it solve?
How is this company trustworthy/worth my time?
For the A/B test, we decided to differentiate by answering these questions with two distinct angles, showing the relationship between our product and our customer. Variation A was product focused, which we aptly named Toolkit. Variation B was customer focused, which we named "Built for you". Variation B also aligns with our "This is How" campaign.


Experiment
After the design and development stage, we launched this experiment with each variation running at 33%, as well as the control (current homepage). Experiment ran for 3-4+ weeks until we achieved statistical significance that helps define the winning variant.
What do we mean by perform?
We're looking at the experiment across 2 main themes:
1. Engagement (scroll depth, site depth, pathing behavior, bounce rate, etc.)
2. Conversion (leads, PSUs, activation rates, etc.)
Results
The variants do a great job at converting and activating companies with <1K FTE.
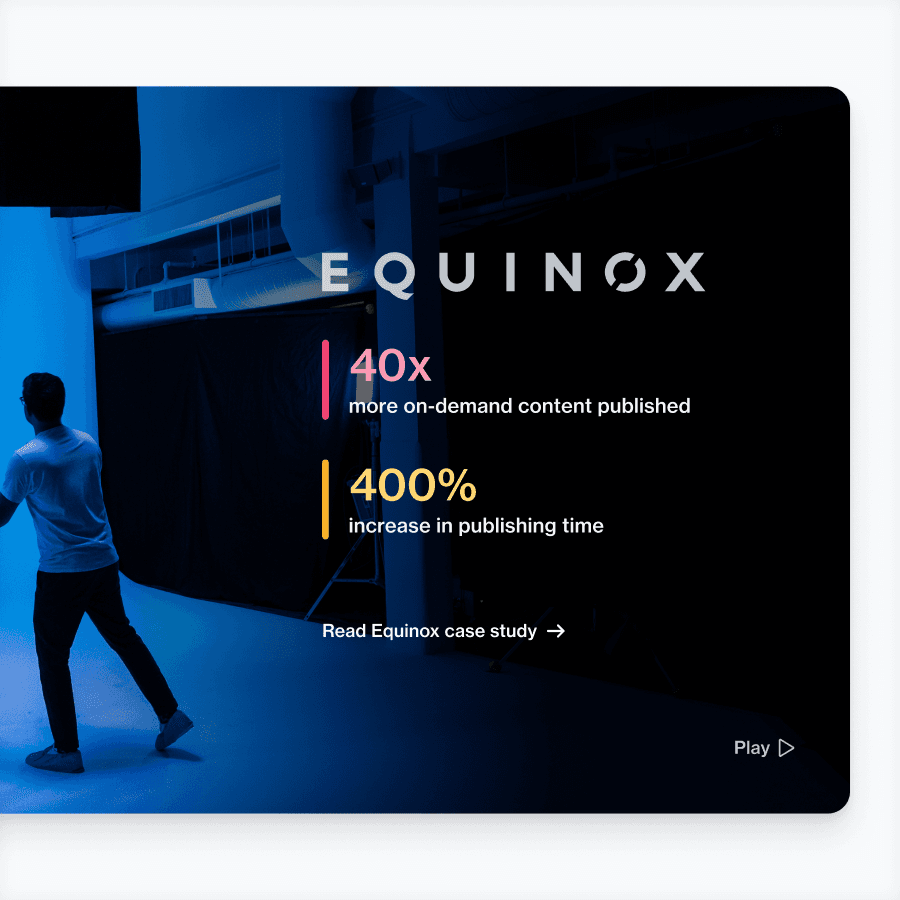
The content we featured on the experiences did a better job of distributing clicks to our content, with more variety of where users clicked. Users actively visited templates, customer stories, and product pages.
Users visited our Contact Sales page more often, we saw directional data that users submitted the form a bit more (not stat sig) and that the mix of people filling out the form was within the target segment we wanted.
Although less trafficked, mobile was a clear winner in terms of experience and something we can use to influence our mobile experience decisions going forward.
Variation A and B improved compared to the overall signup rate, but Variation A (Toolkit) was the winner.
Even though the experiment was successful, our company changed direction in terms of audience, so we ended this experiment and began iterating new experiences to align with our new audience and product strategy.
Learnings
My position allows me to lead the entire web project end-to-end, and I am excited for more opportunities to create a high performing team with impactful designs.
Experiment
After the design and development stage, we launched this experiment with each variation running at 33%, as well as the control (current homepage). Experiment ran for 3-4+ weeks until we achieved statistical significance that helps define the winning variant.
What do we mean by perform?
We're looking at the experiment across 2 main themes:
1. Engagement (scroll depth, site depth, pathing behavior, bounce rate, etc.)
2. Conversion (leads, PSUs, activation rates, etc.)
Results
The variants do a great job at converting and activating companies with <1K FTE.
The content we featured on the experiences did a better job of distributing clicks to our content, with more variety of where users clicked. Users actively visited templates, customer stories, and product pages.
Users visited our Contact Sales page more often, we saw directional data that users submitted the form a bit more (not stat sig) and that the mix of people filling out the form was within the target segment we wanted.
Although less trafficked, mobile was a clear winner in terms of experience and something we can use to influence our mobile experience decisions going forward.
Variation A and B improved compared to the overall signup rate, but Variation A (Toolkit) was the winner.
Even though the experiment was successful, our company changed direction in terms of audience, so we ended this experiment and began iterating new experiences to align with our new audience and product strategy.
Learnings
My position allows me to lead the entire web project end-to-end, and I am excited for more opportunities to create a high performing team with impactful designs.